Financial Projections for a Startup Business Plan: Step by Step (With Example)

Nobody expects a startup’s financial projections to come true. What a reader checks is whether the numbers follow from assumptions you can defend, and whether you understand where the cash runs thin. This guide shows you how to build business plan financial projections from scratch: the assumptions sheet first, then the profit and loss, cash flow and balance sheet, with a fictional software startup worked through three years so you can see every number connect.
- A multi-year budget with recurring and one-time items, start and end dates and growth rates
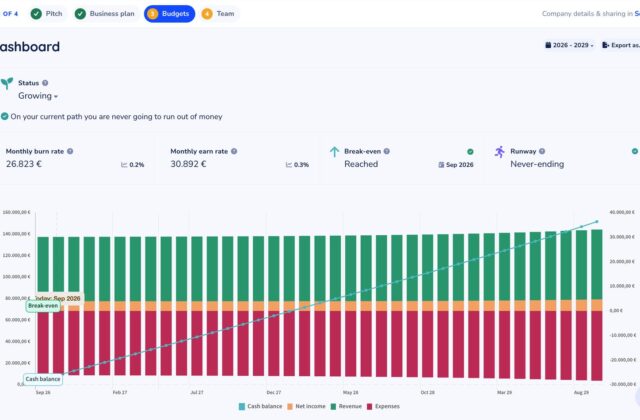
- A dashboard with burn rate, earn rate, break-even month and runway, plus a year-by-year report
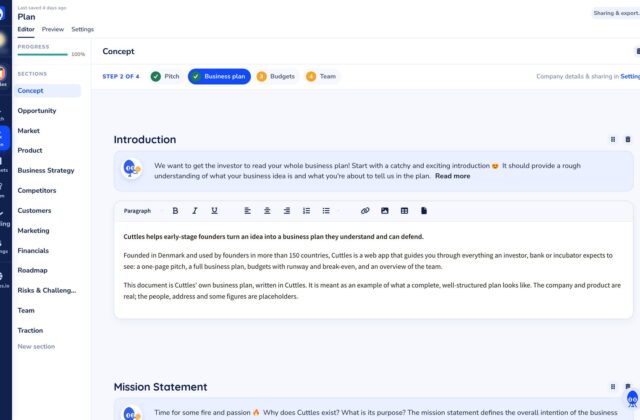
- Charts that flow straight into the Financials section of your business plan
What Financial Projections Are (and What Readers Want From Them)
Financial projections are your estimate of the company’s revenue, costs, profit and cash over the next few years, laid out as financial statements. In a business plan they turn everything you wrote in the other sections into money: the market section becomes a customer count, the pricing section becomes revenue per customer, and the team section becomes a salary line.
The U.S. Small Business Administration suggests that a traditional business plan include projections for five years, with quarterly or even monthly detail for the first year. Most early-stage founders show three years instead: month by month or quarter by quarter for year one, then yearly. Beyond year three, a pre-revenue forecast is mostly guesswork, and experienced readers treat it that way.
Readers use your projections to answer four questions:
- Is the business model viable? Does each customer bring in more than they cost to serve, and is there a path to profit?
- How much money do you need, and when? The lowest point in your cash balance is the real funding requirement.
- Are the assumptions believable? Growth, price, churn and costs should match what you said elsewhere in the plan.
- Do you understand your own numbers? A founder who can explain why margin rises in year two is more convincing than one with a prettier chart.

The Three Statements, at Startup Size
Full projections consist of three linked statements. The U.S. Securities and Exchange Commission’s beginner’s guide to financial statements describes them in the same way you will use them here, just for a much smaller company.
| Statement | What it shows | The question it answers | Startup shortcut |
|---|---|---|---|
| Profit and loss (income statement) | Revenue minus costs over a period | Does the business make money? | Revenue, cost of revenue, gross profit, operating expenses, net profit |
| Cash flow statement | Cash coming in and going out, split into operating, investing and financing | When does the money run out? | Net profit, add back non-cash costs, subtract equipment, add funding |
| Balance sheet | What the company owns and owes at one moment | Does everything reconcile? | Cash, equipment, any debts, and the owners’ equity |
The profit and loss statement covers a period, the balance sheet a single date, and the cash flow statement explains how you got from one balance sheet to the next.
If you are pre-revenue, the profit and loss and the cash flow do most of the work. The balance sheet is still worth building because it is the check that catches errors: assets must always equal liabilities plus equity. If they do not, something in the other two statements is wrong.
Two supporting schedules sit under the statements. A revenue forecast works out customers times price, period by period; our guide to sales forecasting covers the methods. A cost schedule lists salaries, rent, marketing and everything else, split into fixed and variable costs. The startup costs guide covers what you spend before launch.
How to Create Financial Projections in 7 Steps
- Assumptions sheetEvery input in one place
- Revenue forecastCustomers times price
- CostsCost of revenue, then fixed costs
- Profit and lossRevenue minus costs
- Cash flowProfit adjusted to cash, plus funding
- Balance sheetThe reconciliation check
- Sanity checksCompare with reality and your plan
Step 1: Write the assumptions sheet first
Every number in your projections should trace back to a short list of assumptions: price, customer growth, churn, cost per customer, salaries, marketing budget, equipment and funding. Put them on one page. When someone challenges a number, you change one assumption and the whole forecast updates, instead of hunting through formulas. Next to each assumption, write where it came from: a pilot, a quote from a supplier, a competitor’s public price list, a customer interview.
Step 2: Forecast revenue from the bottom up
Revenue is units times price. For a subscription business, that means paying customers in each period times the monthly price times the months in the period. For a shop, it is visitors times conversion rate times average order. Build it from things you can influence, like marketing spend and sales capacity, rather than “we will win 1% of the market”. If you have a market size figure, use it as a ceiling check, not a starting point. The bottom-up market sizing guide explains the difference.
Step 3: Split costs into variable and fixed
Variable costs (cost of revenue, or cost of goods sold) rise with each sale: materials, payment fees, hosting, delivery. Fixed costs stay roughly the same whatever you sell: salaries, rent, insurance, software, most marketing. Revenue minus variable costs is gross profit; divide it by revenue for gross margin. Then list fixed costs by month or quarter, with hires starting in the month they actually join.
Step 4: Build the profit and loss statement
Revenue, minus cost of revenue, gives gross profit. Subtract operating expenses (salaries, marketing, rent, other overheads and depreciation) to get operating profit. Subtract interest and tax to get net profit. For most early startups there is no interest, and there is no income tax to pay in years with a loss; how losses can be used against future profits depends on your country and company type, so check that with an accountant.
Step 5: Build the cash flow statement
Profit is not cash. Start with net profit, then add back costs that did not use cash in that period (depreciation is the usual one). Adjust for timing: customers who pay you 30 days late, stock you bought before selling it. That gives operating cash flow. Subtract equipment purchases (investing) and add money raised from founders and investors (financing). The result is the change in cash. Our cash flow forecast guide goes through the month-by-month version.
Step 6: Close with the balance sheet
At the end of each period, list cash, the book value of equipment (cost minus depreciation so far) and anything customers owe you on one side. On the other, list what you owe and the owners’ equity. If the two sides differ by even a dollar, find the error before you send the plan.
Step 7: Run the sanity checks
The last step is reading your own numbers like a skeptical investor would. The worked example below ends with the checks, and there is a full checklist further down.
A 3-Year Financial Projections Example
Brightbook is a fictional startup that sells online booking and reminder software to independent physiotherapy clinics for $150 per clinic per month. Two founders start the company with a $250,000 pre-seed round and plan to raise a $400,000 seed round in the middle of year two. Every figure below is illustrative, but each one is calculated from the assumptions, so you can check the arithmetic yourself.
The assumptions sheet
| Assumption | Year 1 | Year 2 | Year 3 | Basis (illustrative) |
|---|---|---|---|---|
| Price per clinic per month | $150 | $150 | $150 | Pilot clinics paid this in a 3-month test |
| Average paying clinics | 6 / 18 / 35 / 58 by quarter | 130 | 300 | Net of cancellations; 70 at end of year 1, 190 at end of year 2, 410 at end of year 3 |
| Cost of revenue | 20% | 20% | 20% | Hosting, text message reminders, card fees, onboarding support |
| Salaries incl. payroll costs | $120,000 | $220,000 | $340,000 | 2 founders plus a part-time developer; then 2 hires in year 2 and 2 more in year 3 |
| Marketing | $30,000 | $60,000 | $90,000 | Year 1: $3,000, $6,000, $9,000, $12,000 by quarter |
| Other overheads | $12,000 | $18,000 | $30,000 | Software, insurance, accounting, coworking desks |
| Equipment bought | $12,000 | $6,000 | $6,000 | Laptops and devices at the start of each year, depreciated over 3 years |
| Funding raised | $250,000 | $400,000 | $0 | Equity only, no borrowing |
Customers pay monthly by card in advance, so there are no receivables to track. No income tax is due because the company makes a loss in every year shown.
Year 1 by quarter
Revenue per quarter is average clinics × $150 × 3 months. In Q1 that is 6 × $150 × 3 = $2,700. Cost of revenue is 20% of that, $540, which leaves $2,160 of gross profit. Operating expenses in Q1 are $30,000 salaries + $3,000 marketing + $3,000 overheads + $1,000 depreciation = $37,000.
| Year 1 (illustrative) | Q1 | Q2 | Q3 | Q4 | Year 1 |
|---|---|---|---|---|---|
| Average paying clinics | 6 | 18 | 35 | 58 | |
| Revenue | $2,700 | $8,100 | $15,750 | $26,100 | $52,650 |
| Cost of revenue (20%) | $540 | $1,620 | $3,150 | $5,220 | $10,530 |
| Gross profit | $2,160 | $6,480 | $12,600 | $20,880 | $42,120 |
| Operating expenses | $37,000 | $40,000 | $43,000 | $46,000 | $166,000 |
| Net profit | −$34,840 | −$33,520 | −$30,400 | −$25,120 | −$123,880 |
| Cash at end of quarter | $204,160 | $171,640 | $142,240 | $118,120 | $118,120 |
Cash: $250,000 raised − $12,000 equipment = $238,000 to start. Each quarter, cash changes by net profit plus $1,000 of depreciation added back (it is a cost on paper, not a payment). Q1: $238,000 − $34,840 + $1,000 = $204,160.
Years 1 to 3: profit and loss
Year 2 revenue is 130 average clinics × $150 × 12 months = $234,000. Year 3 is 300 × $150 × 12 = $540,000. Depreciation grows as equipment is added: $4,000 a year for the year 1 laptops, plus $2,000 a year for each later $6,000 batch.
| Profit and loss (illustrative) | Year 1 | Year 2 | Year 3 |
|---|---|---|---|
| Revenue | $52,650 | $234,000 | $540,000 |
| Cost of revenue | $10,530 | $46,800 | $108,000 |
| Gross profit | $42,120 | $187,200 | $432,000 |
| Salaries | $120,000 | $220,000 | $340,000 |
| Marketing | $30,000 | $60,000 | $90,000 |
| Other overheads | $12,000 | $18,000 | $30,000 |
| Depreciation | $4,000 | $6,000 | $8,000 |
| Total operating expenses | $166,000 | $304,000 | $468,000 |
| Net profit | −$123,880 | −$116,800 | −$36,000 |
Gross margin is 80% in every year because cost of revenue is set at 20%. Net loss shrinks from $123,880 to $36,000 as revenue grows faster than costs.
Years 1 to 3: cash flow statement
| Cash flow (illustrative) | Year 1 | Year 2 | Year 3 |
|---|---|---|---|
| Net profit | −$123,880 | −$116,800 | −$36,000 |
| Add back depreciation | $4,000 | $6,000 | $8,000 |
| Operating cash flow | −$119,880 | −$110,800 | −$28,000 |
| Investing: equipment | −$12,000 | −$6,000 | −$6,000 |
| Financing: equity raised | $250,000 | $400,000 | $0 |
| Net change in cash | $118,120 | $283,200 | −$34,000 |
| Cash at start of year | $0 | $118,120 | $401,320 |
| Cash at end of year | $118,120 | $401,320 | $367,320 |
Years 1 to 3: balance sheet
| Balance sheet, end of year (illustrative) | Year 1 | Year 2 | Year 3 |
|---|---|---|---|
| Cash | $118,120 | $401,320 | $367,320 |
| Equipment at cost | $12,000 | $18,000 | $24,000 |
| Less accumulated depreciation | −$4,000 | −$10,000 | −$18,000 |
| Total assets | $126,120 | $409,320 | $373,320 |
| Liabilities | $0 | $0 | $0 |
| Paid-in capital | $250,000 | $650,000 | $650,000 |
| Accumulated losses | −$123,880 | −$240,680 | −$276,680 |
| Total liabilities and equity | $126,120 | $409,320 | $373,320 |
Both sides match in every year. Accumulated losses are the sum of each year’s net profit: −$123,880 − $116,800 = −$240,680, then − $36,000 = −$276,680.
What the Numbers Say (the Sanity Checks)
Building the tables is half the work. The other half is reading them the way an investor will. Here is what Brightbook’s projections reveal.
The seed round is not optional. Without the $400,000, cash at the end of year 2 would be $118,120 − $6,000 − $110,800 = $1,320. That is zero for practical purposes, so the plan has to show the raise happening while there is still runway left. Planning it for the middle of year 2 leaves roughly six months of cash at that point, which is about the minimum a fundraising process needs. The burn rate guide shows how to calculate that runway.
Break-even arrives during year 3. Year 3 costs that do not change with customer numbers total $468,000, or $39,000 a month. Each clinic contributes $150 × 80% = $120 a month after cost of revenue. Break-even is therefore $39,000 ÷ $120 = 325 clinics. With clinics rising steadily from 190 to 410 over the year, Brightbook passes 325 around month 8, which is why year 3 still shows a small loss overall.
Try the same calculation with your own price and costs:
Free calculator: how many customers do you need to break even?
Your break-even point
Turn these numbers into a full business plan with budgets, runway and a pitch. 7-day free trial, plans from €8/month.
Customer acquisition cost looks plausible, but needs proof. In year 2, $60,000 of marketing brings 120 net new clinics (190 − 70), or $500 per clinic. At $120 of monthly contribution, that is paid back in a little over four months ($500 ÷ $120 ≈ 4.2). An investor will accept that only if the pilot data backs it up, and will ask why cost per clinic falls to about $409 in year 3 ($90,000 ÷ 220 net new clinics). The honest answer might be referrals between clinics. If there is no answer, raise the year 3 marketing budget instead.
Growth rates are steep but explained. Revenue grows about 4.4 times from year 1 to year 2 and about 2.3 times from year 2 to year 3. Growth that slows as the base grows is normal. A forecast where the growth rate speeds up in year 3 would need a specific cause, like a new product or a new country, written next to the number.
The text must match the tables. If Brightbook’s market section says it targets 2,000 clinics in its first region, 410 clinics by year 3 is about a fifth of them, which is ambitious. The plan should say so and explain how.

How Investors Read Your Projections
Early-stage investors rarely read projections line by line. They go straight to a handful of places, and you can prepare for each:
| Where they look | What they are checking | How to prepare |
|---|---|---|
| Lowest cash balance | How much you really need to raise | State the month and the amount, and what you will do before it arrives |
| Gross margin | Whether growth makes the company more valuable or just bigger | Show what goes into cost of revenue and how it changes with scale |
| Revenue drivers | Whether growth comes from actions you control | Link customer growth to marketing spend, sales hires or partnerships |
| Headcount plan | Whether the team can deliver the plan | List each hire, the month they start and the cost |
| Use of funds | What their money buys | Tie the raise to milestones: a customer count, a product launch, break-even |
| Assumptions sheet | Where the numbers came from | Label each input with its source: pilot, quote, interview, public price list |
Grant reviewers read the same projections with a different focus: they want a clear budget for the project, matched funding if required, and a realistic timeline. The startup grants database lists grants by country with amounts, deadlines and who can apply, which helps you see what size of project to plan for. Funding match, which pairs your plan with grants and investors, is coming to every yearly Cuttles plan.
Startup Financial Projections Template
Use this skeleton to set up your own sheet or budget. Fill in the assumptions first and leave the statements until every input has a source.
Assumptions: price [$ per unit or per month]; customers [by month for year 1, by year after]; churn [% per month]; cost of revenue [% of revenue or $ per unit]; salaries [each role, start month, annual cost]; marketing [$ per month]; overheads [rent, software, insurance]; equipment [$ and depreciation years]; funding [amount, month, type].
Profit and loss: revenue − cost of revenue = gross profit; − operating expenses = operating profit; − interest and tax = net profit.
Cash flow: net profit + depreciation ± timing differences = operating cash flow; − equipment = investing; + funding raised = financing; opening cash + all three = closing cash.
Balance sheet: cash + receivables + equipment after depreciation = total assets; debts + paid-in capital + accumulated profit or loss = total liabilities and equity. The two totals must match.
Summary for the plan: lowest cash of [$] in [month]; break-even at [customers] in [month]; raising [$] to reach [milestone].
If a free spreadsheet template suits you, SCORE, the SBA’s mentoring partner, publishes a financial projections template that covers the same statements. It works well if you are comfortable with spreadsheet formulas. Our startup budget template guide and the profit and loss statement example go further into individual pieces.
Spreadsheet or Cuttles Budget?
Both work. The choice depends on how much modeling you want to do yourself, and how often the plan will change.
| Spreadsheet template | Cuttles budget | |
|---|---|---|
| Cost | Free | From €8/mo on a yearly plan, 7-day free trial |
| Flexibility | Anything you can build, including a full balance sheet and depreciation schedule | Revenue, expenses and capital as items with dates, periods, growth and growth rates |
| Burn, runway, break-even | You write the formulas | Calculated on the dashboard |
| Year-by-year view | You build the summary tab | Report tab with capital, expenses, revenue and cash balance per year |
| Link to the plan text | Copy and paste charts | Charts appear in the plan’s Financials section automatically |
| Scenarios | Copy the file | Several budgets per startup |
If an investor asks for a formal three-statement model with a balance sheet, a spreadsheet (or your accountant) is the right tool for that final step. The Cuttles budget covers the cash-focused forecast most early-stage plans lead with.

Financial Projections Checklist
- Every input sits on one assumptions sheet, with a source written next to it.
- Revenue is built from customers times price, not from a share of the market.
- Customer numbers are net of cancellations, and churn is stated.
- Cost of revenue grows with sales; fixed costs start in the month they really begin.
- Every hire has a start month and a fully loaded cost.
- Revenue minus costs equals profit in every period (check the totals by hand once).
- The cash flow starts from net profit and adds back depreciation.
- The balance sheet balances in every period.
- The lowest cash point is named, with the month and what you will do before it.
- Break-even is calculated and the month is stated.
- Customer acquisition cost and payback period are shown and explained.
- Numbers in the plan text match the numbers in the projections.
- Year 1 is shown by month or quarter; years 2 and 3 at least by year.
Mistakes That Undermine Projections
- Top-down revenue. “1% of a $4 billion market” gives no clue how you get there. Build from marketing spend, conversion and price.
- Treating profit as cash. A profitable month can still empty the bank account if customers pay late or you buy stock upfront.
- Forgetting payroll costs. Salary is not the full cost of an employee. Add payroll taxes and benefits in your country.
- Hiring on day one. Projections that start every hire in January overstate early costs; projections that never hire overstate profit.
- No downside case. Build a second version with growth 30% slower and see whether the lowest cash point is still survivable. In Cuttles, a second budget on the same startup does this without touching the first.
- Precision theater. Revenue of $1,284,516.37 in year three suggests false accuracy. Round to sensible numbers and spend the time on the assumptions instead.
Once the projections hold up, they feed straight into the rest of the plan. Our guide on how to write a business plan shows where the financial section fits, and the seed capital guide covers how much to raise against your lowest cash point.
Sources
- U.S. Small Business Administration, Write your business plan (financial projections for five years, with quarterly or monthly detail for year one).
- U.S. Securities and Exchange Commission, Beginners’ Guide to Financial Statements (balance sheet equation, income statement, cash flow categories).
- SCORE, Financial Projections Template.
- Brightbook is a fictional company. All figures in the example are illustrative and calculated from the stated assumptions.
Get the assumptions right, find your lowest cash month, and the rest of the projections are arithmetic. — Cuttles